LOGTITAN is integrated with Kibana, an open-source data visualization tool that provides additional flexibility when navigating data. This allows users to create custom visualizations and interactive dashboards for greater visibility into an environment.
Why Use Kibana?
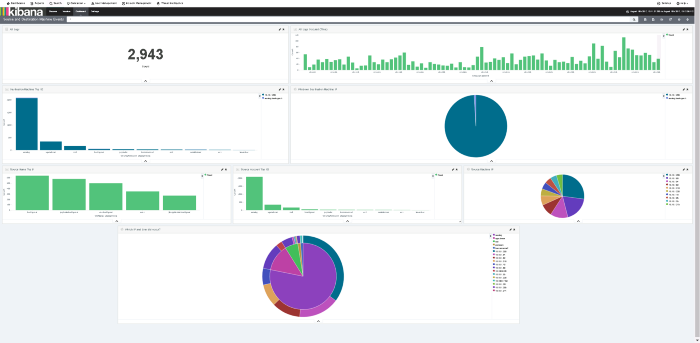
Kibana offers histograms, line graphs, pie charts, sunbursts, geospatial map displays, and other common visualization options along with the option for one to create his or her own unique visualization option.
Kibana also makes it possible for users to spot and analyze relationships in Elasticsearch data and detect and explore anomalies in Elasticsearch data with machine learning features. As an added benefit, those who are responsible for analyzing and compiling data can easily share the information they have gathered with supervisors, colleagues, and customers thanks to Kibana’s dashboard sharing options and the program’s ability to allow dashboards to be inserted into an internal wiki or website pages. Alternatively, one can send out the URL to the dashboard in question or even export important data in PDF or CSV format. It comes with its own Node.js server so users don’t have to install additional code or invest in new, updated infrastructure to run the program.
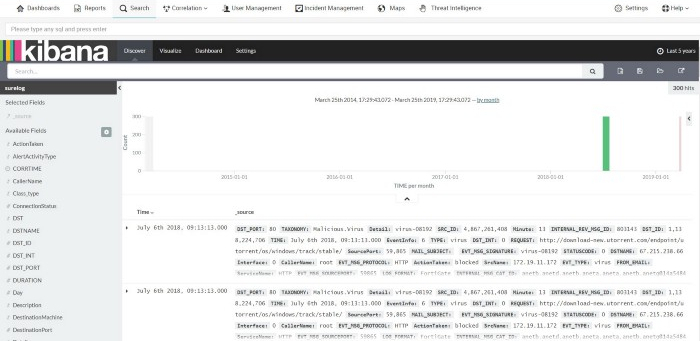
Kibana delivers an easy method to traverse and analyze your data with custom visualizations, ad hoc reporting capabilities, time series, relationship analytics, and geo-mapping.