LOGTITAN NG-SIEM PROFILER
LOGTITAN leverage automated behavioral profiling to automatically detect anomalies and autonomously define rules on the data, to discover security events that require investigation. Behavior analysis and profiling relies on statistical modeling and data science in LOGTITAN in order to identify patterns of behavior and compare them against other human or machine activities. The Profiler is a feature extraction mechanism that can generate a profile describing the behavior of an entity. An entity might be any field of messages like protocol used in communication as well as a server, user, subnet or application. Once a profile has been generated defining what normal behavior looks-like, models can be built that identify anomalous behavior.
In LOGTITAN; Profiler is enhancing SIEM Correlation Rules Through Baselining. This is achieved by summarizing the streaming telemetry data consumed by LOGTITAN over sliding windows. Profiling is compressing time. A summary statistic is applied to the data received within a given window. Collecting this summary across many windows results in a time series that is useful for analysis.
Events and Trends
Any field contained within a message can be used to generate a profile. A profile can even be produced by combining fields that originate in different data sources. A user has considerable power to transform the data used in a profile by leveraging the LOGTITAN correlation engine. LOGTITAN Rule As a Code platform [1] which is powered by JAVA is the defining point for profiles. Profiler in correlation engine can be configured using JAVA.
Profile definition:
Profiles
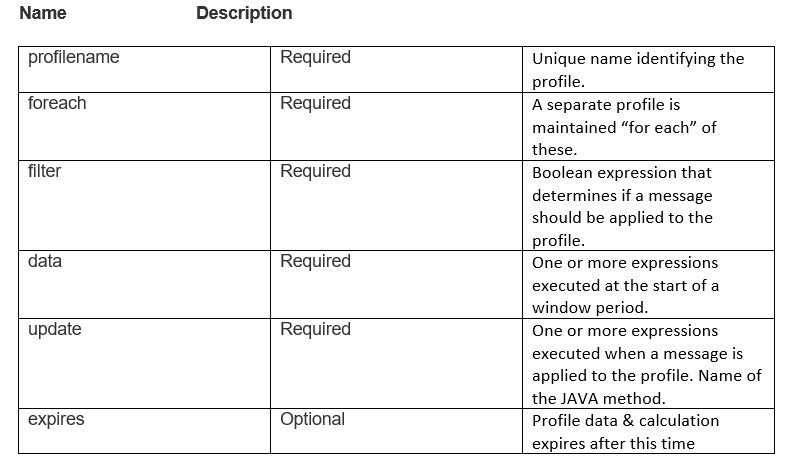
A profile definition requires JAVA method definition. The specification contains the following elements.
Example 1:
The ratio of DNS traffic to HTTP traffic for each host. The following profiler rule as a code would be used to generate this profile.
Baseline creation:
in this case, a particular user will be known. The following examples show how this profile data might be retrieved. Retrieve all values of ‘http_protocol/dns_protocol’ from over the past 4 weeks of the 4th day of the week (Tuesday) and calculate percentiles (A percentile (or a centile) is a measure used in statistics indicating the value below which a given percentage of observations in a group of observations fall. For example, the 20th percentile is the value (or score) below which 20% of the observations may be found.)
Example 2:
The total number of bytes of HTTP data for each host
The following example shows how this profile data might be retrieved. Retrieve all values of ‘http_protocol/dns_protocol’ from over the past 4 weeks of the 4th day of the week (Tuesday) and calculate percentiles and get the Source IPs in which HTTP traffic is more than %95 of others Source IPs.
Example 3:
The average of the length field of HTTP traffic. The following configuration would be used to generate this profile.:
In order to create average/mean
Example 4:
These examples assume a profile has been defined called ‘snort-alerts’ that tracks the number of Snort alerts associated with an IP address over time. The profile definition might look similar to the following.
In order to create average/mean
Profiler learns from what users and entities do on a regular basis, for instance,
- where do users log in from?
- what devices do they log in from?
- what file servers and applications do they access?
- what privileges do they have? and so on.
Example 5:
How to detect when a user login for first time in a system?
How to retrieve this profile and how to check if it is a never seen login.