NETWORK ACTIVITY MAP
With LOGTIAN SIEM it is possible to see what happened by looking at a picture instead of dive into the logs.
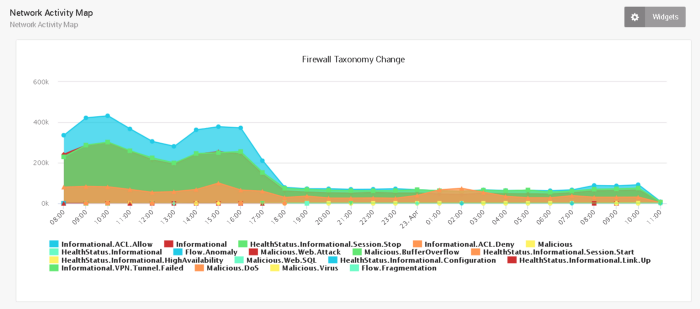
LOGTITAN Network Activity Map
Searching for text is the most basic way to find what you’re looking for. It is very time consuming and hard to find security problems with just log searching.
Find what is going on your network the easy way with LOGTITAN. LOGTITAN has a dashboard. In this dashboard,
- You can see what occurred in your network for the last 24 hours, 30 days, etc..,
- You can see trends,
- You can detect anomalies visually.
This saves a lot of time because you don’t have to think about “event ids”, “message keywords” for a heterogeneous network when troubleshooting a security problem.
Also, Visualization is the key for seeing millions of logs just in one graph with all the required data, trends and anomalies.
LOGTITAN utilizes log parsing, normalization, taxonomy, and visualization at the same time to produce the “Network Activity Map” dashboards.